


Dr. Jana Broadhurst and her team developed a modified PCR saliva test at Emerging Pathogens Laboratory at the University of Nebraska Medical Center. Photographed in Omaha on Tuesday, June 7, 2022.
OMAHA — Doug Rose has checked COVID-19 case counts and other data off and on during the pandemic, but he says he was never obsessed with it.
He has reviewed case counts for his destination when he planned to travel. Last year, the retired Omaha schoolteacher went to Galveston, Texas, instead of his usual spot in the Rio Grand Valley because of concerns about a potential for increased COVID-19 cases there.

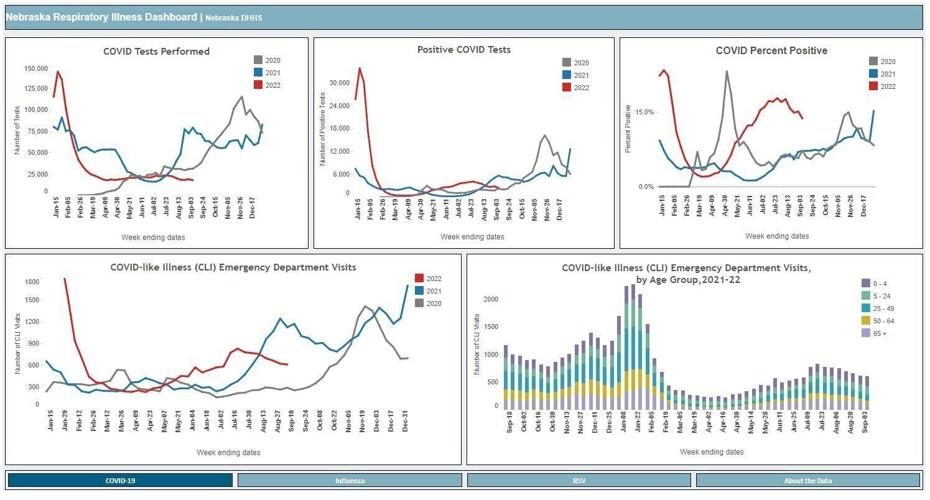
The dashboard maintained by the Nebraska Department of Health and Human Services has evolved throughout the pandemic.
But now that he's vaccinated and boosted, he doesn't worry much about the virus. "You read the data when it's put out and decide what you're going to do," he said.
Just like the public's interest, the data reported by public health agencies has ebbed and flowed over the course of the COVID-19 pandemic.
While the federal Centers for Disease Control and Prevention continue to operate a beefed-up dashboard, the Nebraska Department of Health and Human Services has replaced its COVID-19 dashboard with a respiratory illness dashboard that includes data on COVID-19, influenza and respiratory syncytial virus, or RSV. Some school districts and colleges also have mothballed their dashboards, with some exceptions being Lincoln Public Schools and the University of Nebraska-Lincoln.
People are also reading…
But during the early days of the outbreak in 2020, the nation was dealing with an unknown opponent. The first case in Nebraska was announced March 6 of that year. A month later, the count had reached 255. Interest in the numbers intensified as cases mounted and schools and businesses closed.
Initially, data was hard to come by. People who were monitoring the numbers had to tap multiple sources. Individuals, academic institutions and news organizations such as Covid Act Now, Johns Hopkins University and the New York Times stepped in to provide data that the public could easily access and digest.
Public health agencies had to quickly ramp up systems for gathering, verifying and displaying data.
The CDC noted on its website that only a handful of health care facilities and states were capable of using electronic case reporting in early 2020. Reporting was slow and often relied on paper-based systems and fax machines.
By August 2021, all 50 states and some other jurisdictions had electronic reporting capabilities.
Justin Frederick, division chief of epidemiology and preparedness with the Douglas County Health Department, said counting cases seems like a simple process. But it's a complex endeavor to collect, verify and store it.
"Public health infrastructure, including our disease surveillance systems, were not set up for a pandemic," he said.

Justin Frederick
As a health care hub, the Omaha metro area attracts a lot of people for testing and treatment. The test results of out-of-towners who were tested in Omaha for COVID-19 had to be reported to their home counties, and rectifying numbers based on patients' residences is challenging, particularly in real time, Frederick said. When test results mounted to thousands a day, health officials had to sort positives and negatives to calculate positivity rates and break down results demographically by age, ethnicity and ZIP code.
Initially, test results coming in from laboratories had to be entered manually every day into the health department's surveillance system. Later, labs began reporting electronically, but new labs kept popping up and had to be added to the system. The health department eventually was able to funnel those results directly into its system.
The Douglas County Health Department, like those across the state, was trying to keep up with contact tracing, which was important in identifying the risk the virus posed to the population. That risk, in turn, drives public health mitigation efforts, such as closing bars and requiring masking. At one point, Frederick said, the county was receiving thousands of new cases a day. Frederick was overseeing nearly 50 of the county's own contact tracers, and the department had a contract with a firm in Omaha that could supply between 200 and 400 contact tracers at a time.
In the middle of that, the department put up an online dashboard because health officials wanted a way to communicate with the public. Douglas-Omaha GIS (for Geographic Information Systems) developed the dashboard, but the health department supplied the data and worked closely with the office to determine how to display it.
"I can't stress enough the importance of us reporting daily data," Frederick said. "There was a lot of demand from the public."
Lindsay Huse, the Douglas County Health Department's director, said the next challenge was interpreting the data and boiling it down in a way that people could understand it and use it to make decisions.
People stepped in to help with that, too.
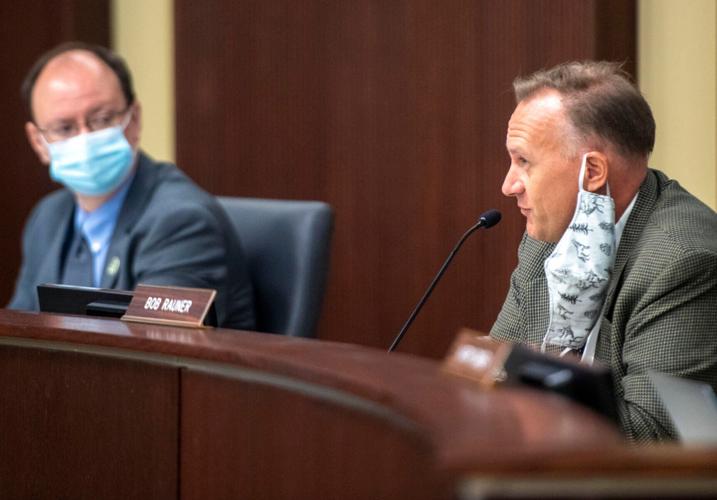
On March 8, 2020, Dr. Bob Rauner, president of Partnership for a Healthy Lincoln, began posting short YouTube videos sharing and explaining available COVID-19 data. He also walked through coronavirus research and trends as they emerged and included links to his sources.

Dr. Bob Rauner (right) speaks at a Lincoln Board of Education meeting during the pandemic. Rauner, president of Partnership for a Healthy Lincoln, has continued to post YouTube videos sharing and explaining available COVID data.
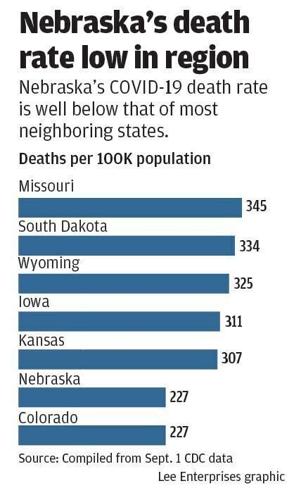
More than two years later, on July 13, Rauner posted his 115th Community Coronavirus Update. One of his updates got as many as 28,000 views. He stopped counting when the series surpassed half a million views. Rauner, who serves on the Lincoln Board of Education, explored the impact of the pandemic in his videos, tallying COVID-related deaths in Nebraska and surrounding states.
"I think the reason they took off is because I just said, 'Here's what the data shows.' And if you wanted to look, you could go to the links and find it all," Rauner said.
Partnership for a Healthy Lincoln also began posting its own case charts, with county-by-county data, after Ted Fraser, its health data analyst, figured out how to retrieve it from the CDC.
The Nebraska Department of Health and Human Services also launched a dashboard early in the pandemic. The dashboard, which changed nearly every month as conditions shifted, was a key piece of the agency's strategy for communicating with the public, said Ashley Newmyer, the agency's chief data strategist.
Dr. Gary Anthone, the state's chief medical officer, said another piece of that strategy were the public briefings he and Gov. Pete Ricketts held during the pandemic. They were held often during the early days of the pandemic and later when cases and hospitalizations spiked.

Gary Anthone
Early on, Anthone said, people mostly wanted to know why they couldn't get tested for COVID-19. Initially, all tests had to go through the CDC, and criteria for getting tested were stringent.
After the state launched TestNebraska and Nebraskans could get tests whenever they wanted, positivity rates became a less important metric, he said. The state began looking to the number of people hospitalized with COVID-19 as its "north star" in measuring the stress COVID-19 patients were placing on the state's hospitals. The state therefore added a variety of hospital capacity metrics to the dashboard.
Both the Lincoln-Lancaster County and Sarpy/Cass health departments continue to operate detailed dashboards. Lincoln's Bryan Health reports on patients hospitalized with the virus by age and vaccination status as well as where they're from and whether they require intensive care or ventilators.
But much of the county-level reporting at the state level ended when the state retired its more detailed COVID-19 dashboard June 30, 2021, after Ricketts ended the state's COVID-19 state of emergency. At that point, Anthone said, 27 Nebraskans were hospitalized with COVID-19, down from a peak of 987 in November 2020.

The pandemic emergency had suspended some restrictions in state law on the release of communicable disease data, state officials said at the time, permitting them to release more information than otherwise would be allowed.
The expiration of an executive order at that time also prevented Nebraska's health districts from publicly reporting COVID-19 statistics, such as case numbers and vaccinations, for counties with fewer than 20,000 people.
At the time, Nebraska health care providers and a group of lawmakers called for Ricketts to reinstate the dashboard. The state, which had continued to post weekly summaries, redeployed the dashboard in August 2021, this time focusing on hospital data.
Newmyer said the public also faced a learning curve in figuring out what data the state collected and what it could make available to the public. In addition to trying to meet the public's demand for information, the state Department of Health and Human Services also sought to provide enough background information so users could understand the limits and nuances of that data.
Dr. James Lawler, a co-executive director with the University of Nebraska Medical Center's Global Center for Health Security, said getting good data into the systems remains his concern. The CDC's pediatric COVID-19 death data, for instance, has changed multiple times, he said.

James Lawler
Lawler said he doesn't think most people understand the difficulty of getting accurate health data, much of which is stored in systems that can't talk to each other. Health agencies, for instance, can't pull data from hospitals' electronic medical records, as they can in some European nations. Most health care in the U.S. is delivered by the private sector, where there's little incentive for competing systems to share information.
"These are all challenges we still need to grapple with, because it's impossible to effectively respond if you don't have good situational awareness," Lawler said.
Some new types of data also emerged during the pandemic. After establishing a wastewater-monitoring network, the state began posting weekly reports with those results. It also added a weekly report with the results of genomic sequencing. (Wastewater testing can provide an early warning about trends in cases, while genomic sequencing provides insights into what variants are circulating.)
Other health data also is getting a more public airing.
Newmyer said the state agency continues to evaluate whether other diseases or data should be added to the respiratory illness dashboard, which the agency plans to continue to update weekly.
The agency also has launched a dashboard to display data from the Behavioral Risk Factor Surveillance System, a telephone health survey of adults 18 and older that is conducted in all U.S. states and territories. Covering topics ranging from physical activity to alcohol use, the survey is used to identify new and emerging health issues, establish and track health objectives and evaluate disease-prevention activities in the state.
Newmyer said the agency also is working on a data initiative around drug overdoses and is looking at making annual reports across its departments available in dashboard forms that are more accessible to the public.
Partnership for a Healthy Lincoln already has begun charting maternal child health data for the state, some of it by county, sourced from the CDC.
Rauner said making such data easily accessible allows people to see how their community is doing on various health measures. It's also important in planning for health.

Lindsay Huse
"The data transparency needs to be out there," he said. "You can't provide good governance without good data."
Huse said she plans to keep the Douglas County dashboard up at least through winter, depending on whether new COVID-19 variants emerge and how well the new boosters work. The department likely will keep providing some data until the virus settles into a more predictable pattern, like influenza.
"That transparency is so important," she said.
Huse said she hopes to put additional county health metrics, such as elements of the community health needs assessment that the agency conducts every few years, in a dashboard format.
"I hope people have more of an interest in the data," she said, "because it helps them understand a little bit more where our priorities are ... and what's happening in the community they live in."

Rauner


